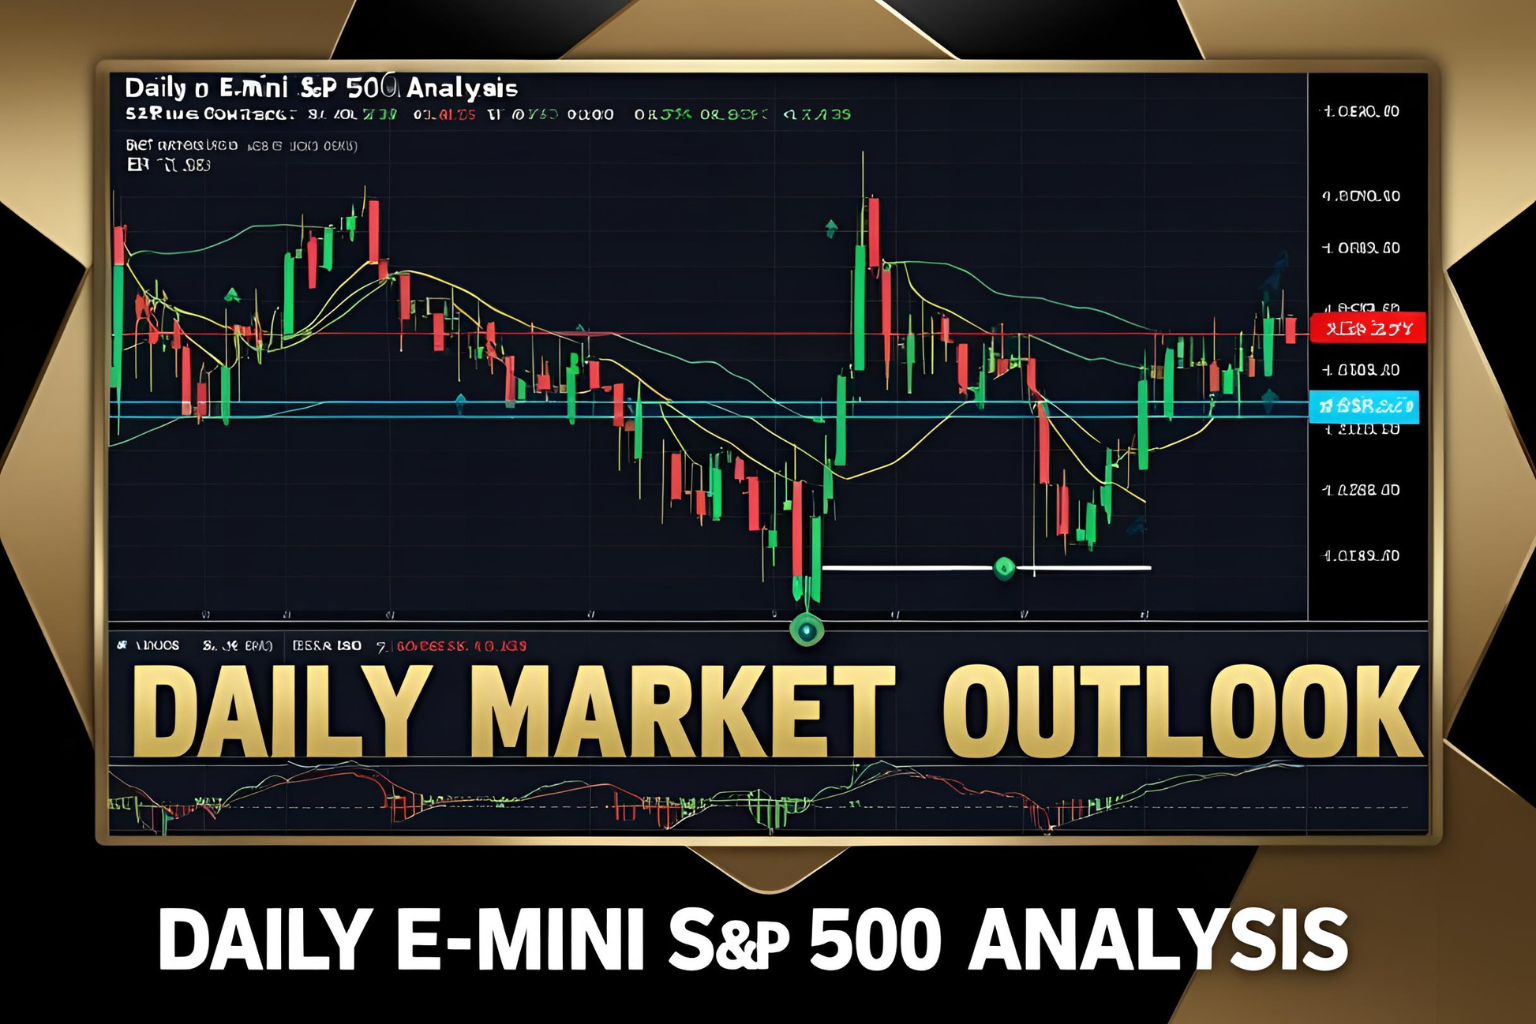
Daily E-mini S&P 500 Futures Market Analysis
The E-mini S&P 500 (ES) futures contract is one of the most actively traded financial instruments globally. It reflects the movements of the S&P 500 index and is a favorite among day traders, swing traders, and institutional participants. Staying updated with daily market analysis is essential to identify trends, key levels, and potential opportunities.
In this post, we’ll walk through how to perform your own ES futures analysis and what key indicators and events to monitor each day.
Key Areas to Focus on in Your Daily Analysis
1. Previous Session Review
Begin by reviewing the previous trading session’s performance:
- Open, High, Low, Close (OHLC)
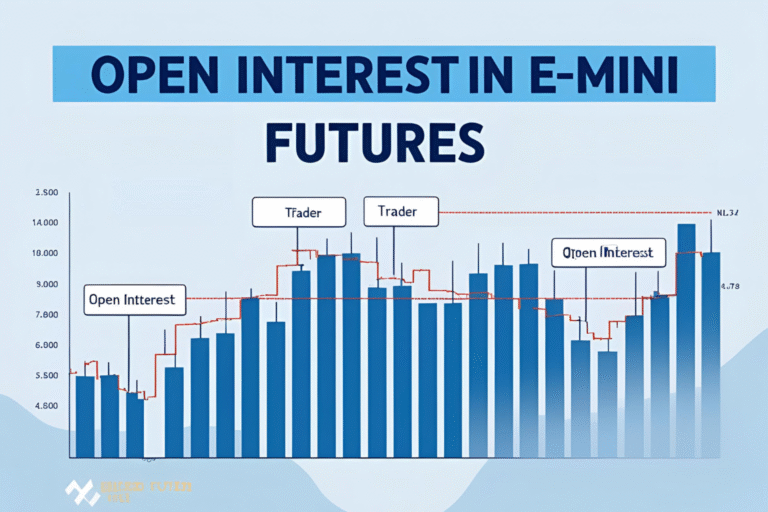
- Volume trends
- Market sentiment (e.g., risk-on or risk-off tone)
Example:
Yesterday’s ES futures traded in a 45-point range, finding resistance near 5220 and support around 5175, reflecting hesitation ahead of CPI data.
2. Identify Key Support and Resistance
Plot key levels based on:
- Pivot points
- Moving averages (20/50/200 EMA)
- Recent swing highs and lows
- Volume profile zones
Watch for confluence between technical indicators and market structure.
3. Trend and Momentum Analysis
Use basic indicators like:
- Moving Averages (to define short-, mid-, and long-term trends)
- MACD or RSI (to assess momentum)
- VWAP (for intraday bias)
Example:
ES remains above the 50-period EMA on the 4-hour chart, suggesting a bullish trend. RSI is currently neutral at 55.
4. News and Economic Events
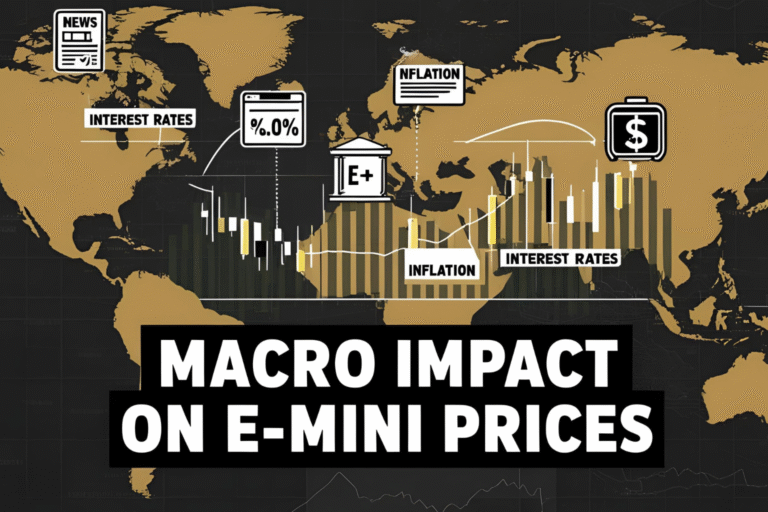
Daily ES price action is highly sensitive to economic data. Monitor:
- Economic calendar (e.g., CPI, NFP, Fed speeches)
- Earnings season updates
- Fed fund rate expectations and bond yields
Use sites like ForexFactory or CME FedWatch Tool for schedule tracking.
5. Market Sentiment and Correlations
Compare ES futures with:
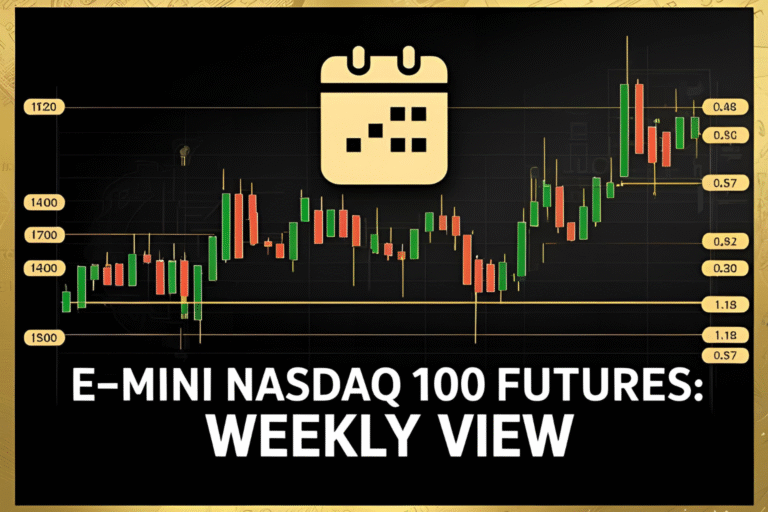
- Nasdaq 100 (NQ)
- Dow Jones futures (YM)
- VIX Index (for fear gauge)
- Treasury yields and DXY (U.S. dollar strength)
Correlated market movement can signal broad risk-on or risk-off behavior.
Sample Daily Trade Plan (Template)
- Bias: Bullish if price holds above 5180, bearish below 5160
- Intraday Resistance: 5215, 5240
- Intraday Support: 5175, 5150
- News to Watch: U.S. inflation data at 8:30 AM ET
- Setup to Monitor: Breakout above 5215 on volume → potential long toward 5240
FAQs
How do I get live ES futures charts for daily analysis?
Use platforms like TradingView, NinjaTrader, or your broker’s charting tool with real-time data.
What time does daily ES trading start?
E-mini S&P 500 futures begin trading at 6:00 p.m. ET on Sunday and continue through Friday at 5:00 p.m. ET.
Which indicators are best for analyzing ES futures?
Common indicators include VWAP, RSI, MACD, and moving averages. Volume Profile and order flow tools are also helpful.
How much does news impact ES futures?
High-impact news events like CPI or Fed rate decisions can create major moves and increased volatility in ES.
Can I rely solely on technicals for ES analysis?
It’s best to combine technical analysis with macro news and sentiment for a balanced view.