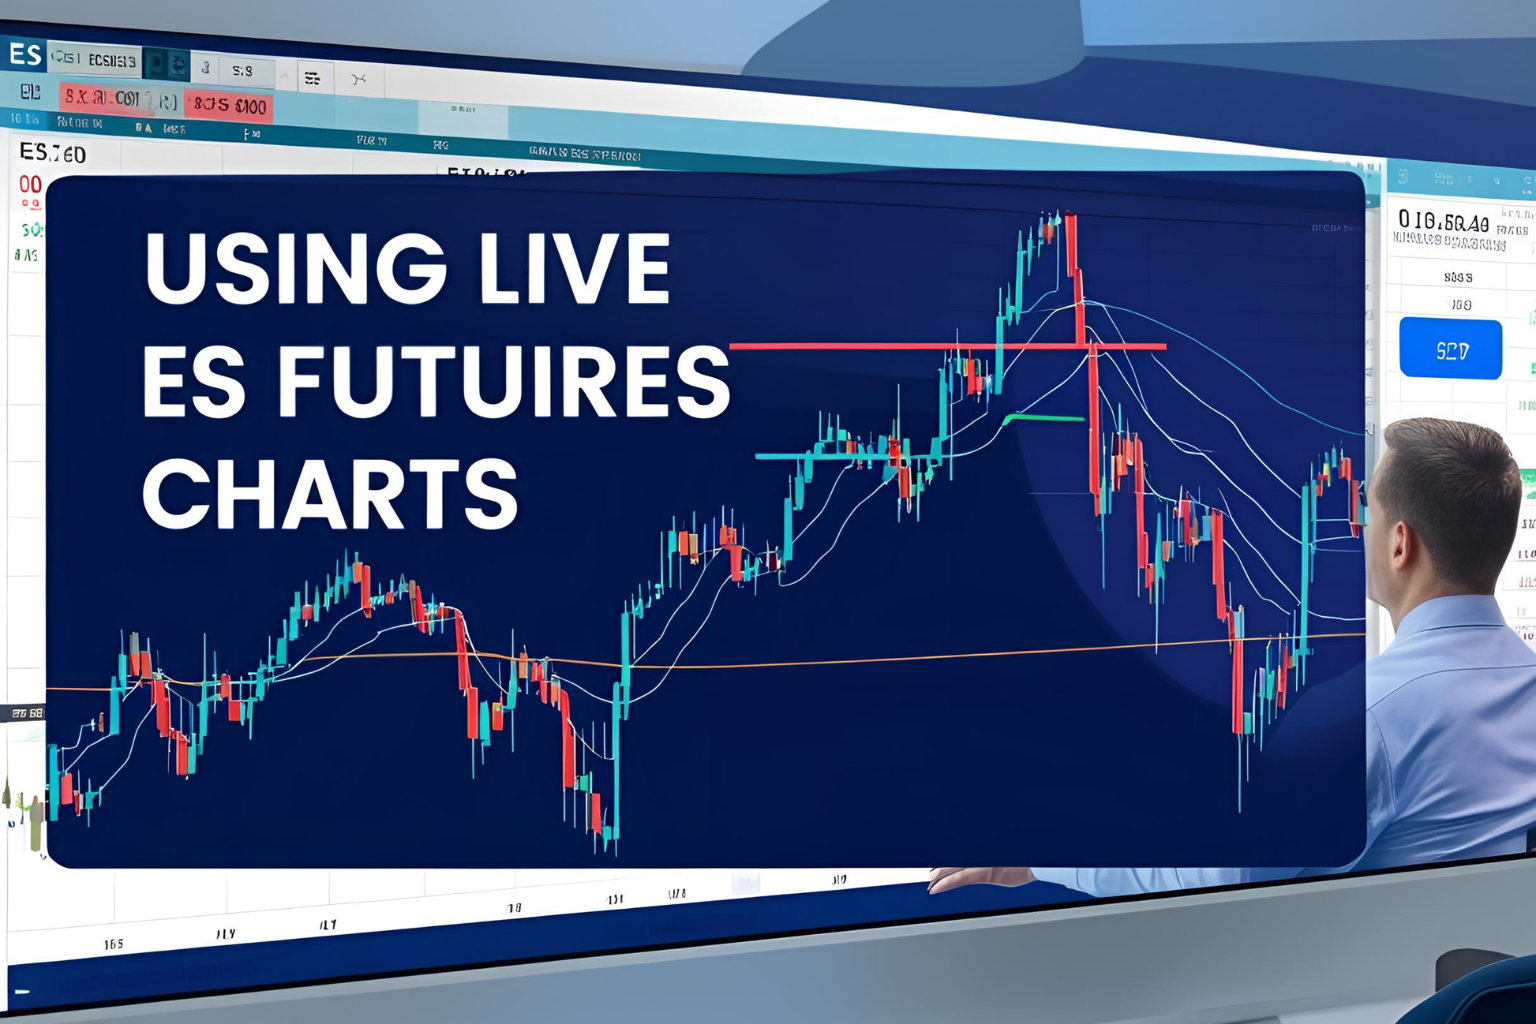
How to Use E-mini S&P 500 Futures Live Charts
Live charts are a vital tool for every E-mini futures trader. Whether you’re trading the S&P 500 (ES) intraday or analyzing longer-term trends, having access to accurate and real-time chart data can dramatically improve your decisions. In this guide, we’ll cover how to use E-mini S&P 500 futures live charts effectively, what features to look for, and which platforms to use.
Why Live Charts Matter in E-mini Trading
The E-mini S&P 500 (ES) contract is one of the most liquid and actively traded instruments in the world. Traders rely on real-time charts to:
- Spot price breakouts and trend reversals
- Identify key support and resistance levels
- Time entries and exits with precision
- Apply technical indicators for confirmation
A delayed chart can mean missed opportunities—or worse, entering a trade too late.
Best Platforms for Live ES Charts
| Platform | Key Benefits |
|---|---|
| TradingView | Easy to use, customizable, browser-based |
| NinjaTrader | Professional-grade futures platform |
| Thinkorswim (TOS) | Great charting tools with paper trading |
| TradeStation | Robust tools with built-in brokerage |
| Interactive Brokers | Fast execution with real-time chart feeds |
Note: Real-time CME data may require a small subscription fee, depending on the platform.
How to Read an E-mini Live Chart
1. Set the Right Timeframe
- 1-minute to 15-minute: For scalping and day trading
- 1-hour or 4-hour: For swing setups
- Daily or weekly: For macro trend analysis
2. Use Core Indicators
Start with a few essentials:
- VWAP: Shows volume-weighted average price—great for intraday bias.
- EMA (20/50/200): Helps spot trend direction.
- RSI or MACD: Confirms momentum and overbought/oversold levels.
3. Mark Key Levels
Draw zones for:
- Yesterday’s high/low
- Pre-market high/low
- Major support and resistance from recent sessions
Use horizontal lines or zones for clear visual references.
Customizing Your ES Chart View
Every trader has preferences, but a typical layout includes:
- Candlestick chart with 5-min or 15-min intervals
- Volume bars below the chart
- Indicators like VWAP, EMA, and RSI
- Price action zones marked using rectangle or horizontal line tools
Tip: Save multiple layouts for scalping, swing trading, and weekly review.
Live Chart Tips for Better Trade Decisions
- Use alerts for breakouts and reversals.
- Avoid overloading charts with too many indicators.
- Zoom out regularly to assess overall trend context.
- Always confirm price action with volume and structure, not just indicators.
FAQs
Where can I get a free E-mini S&P 500 live chart?
TradingView offers free delayed charts and paid real-time data. Most brokers provide real-time ES charts with funded accounts.
Do I need real-time data for paper trading?
Yes, if you’re practicing execution and reaction timing. Otherwise, delayed data may be fine for strategy testing.
Can I trade directly from the chart?
Yes. Platforms like NinjaTrader, TOS, and TradeStation allow you to place, modify, and manage orders directly on the chart.
Which timeframe is best for intraday ES trades?
The 5-minute and 15-minute charts are most commonly used for intraday setups.
How often does the ES chart update?
With real-time data, ES charts update tick-by-tick—every trade, bid, or ask change is reflected instantly.